
This analysis requires DataCello Pro
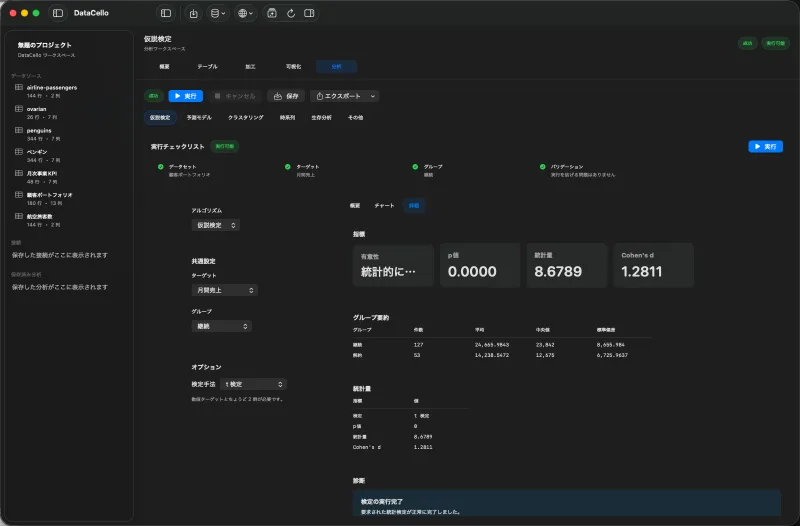
Running the test requires DataCello Pro. The dataset needs a group field with exactly two values and a numeric order-value field. Also confirm that each row can be treated as an independent observation.
Configure the t-test
- Select the A/B dataset, click the
Analysistab, and chooseHypothesis Test. - Select
t-testfrom the method menu. - Set order value as
Targetand the A/B field asGroup. - Resolve the run checklist at the top and click
Run.
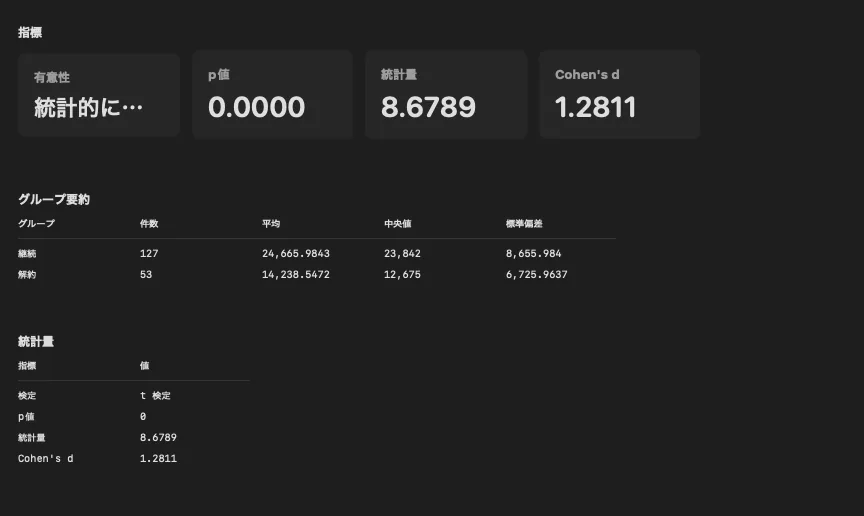
DataCello uses Welch's t-test here, rather than Student's t-test with an equal-variance assumption.
Read p-value and effect size together
The result includes the test statistic, p-value, Cohen's d, group count, mean, median, standard deviation, and a box plot.
- The p-value relates the observed result to a no-difference assumption.
- Cohen's d standardizes the size of the mean difference.
- Summaries and the box plot show spread and possible outliers.
Decision limits
A test result alone does not prove the causal effect of a treatment. Review random assignment, observation period, repeat users, attrition, and sample size. A paired t-test is not part of this workflow.